Data Solutions Portfolio
Python With Google Cloud
Google Cloud Platform Is a powerful ecosystem with a plethora of products for different needs. One of its offerings is Big Query, which is a robust cloud based data warehouse. Data warehouses are generally used to house historical data for business intelligence purposes. Like many data bases and warehouses, python.
Via googles credentials api remote access to cloud environments and resources are accessible remotely. Utilizing this, In this project I developed an ELT(Extract, Load, Transform) pipeline, Using python and SQL with Big Query. I then connect one of Googles Data visualizations tool Data Studio to create an intuitive dashboard to allow for easy interaction and analyzing of data from a business intelligence standpoint.
Google Cloud
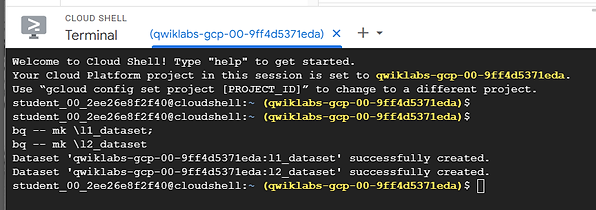
In the google cloud console, I launch the cloud shell and use the necessary shell commands to create the schema (Project_id,dataset and table structure, location etc.) in Big Query.
Then I use google cloud administration tools (IAM) to create a new private key and service account that will allow remote access.

Python
With the service account key setup. I can connect to the Big Query Datawarehouse via python. I will be retrieving Dallas city 311 data for 2022, through API’s. In order to do this I need to develope the socrata system query for the kind of dat a I want add it the the endpoint for the 311 dataset. The endpoint will be stored in file with other arguments such as the google cloud project name that will be used.

These arguemnts and the seperate credential file will be imported when the python script is ran

Once executed python will retrieve the data and insert it into the “l1_tables” dataset. which will hold the raw unmodified data.
Data Transformation
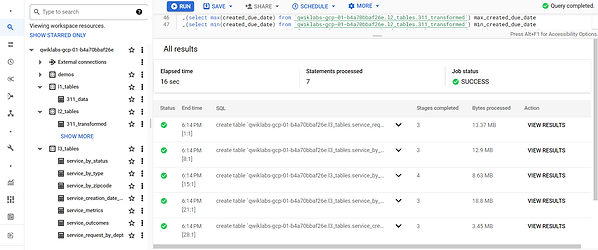
After the data is loaded into the datawarehouse. SQL is used to transform the data and create new fields. This data is housed in the l2_tables dataset. Then the l2 data is used to create smaller tables for specific calculations, aggregations and groupings, which will be used for reporting and visualizing data.
Data Visualization
To visualize the L3 tables I connect data studio to the datawarehouse. The user-end product is an interactive dashboard with powerful visuals that provide insight into trends and performance.